My Trend
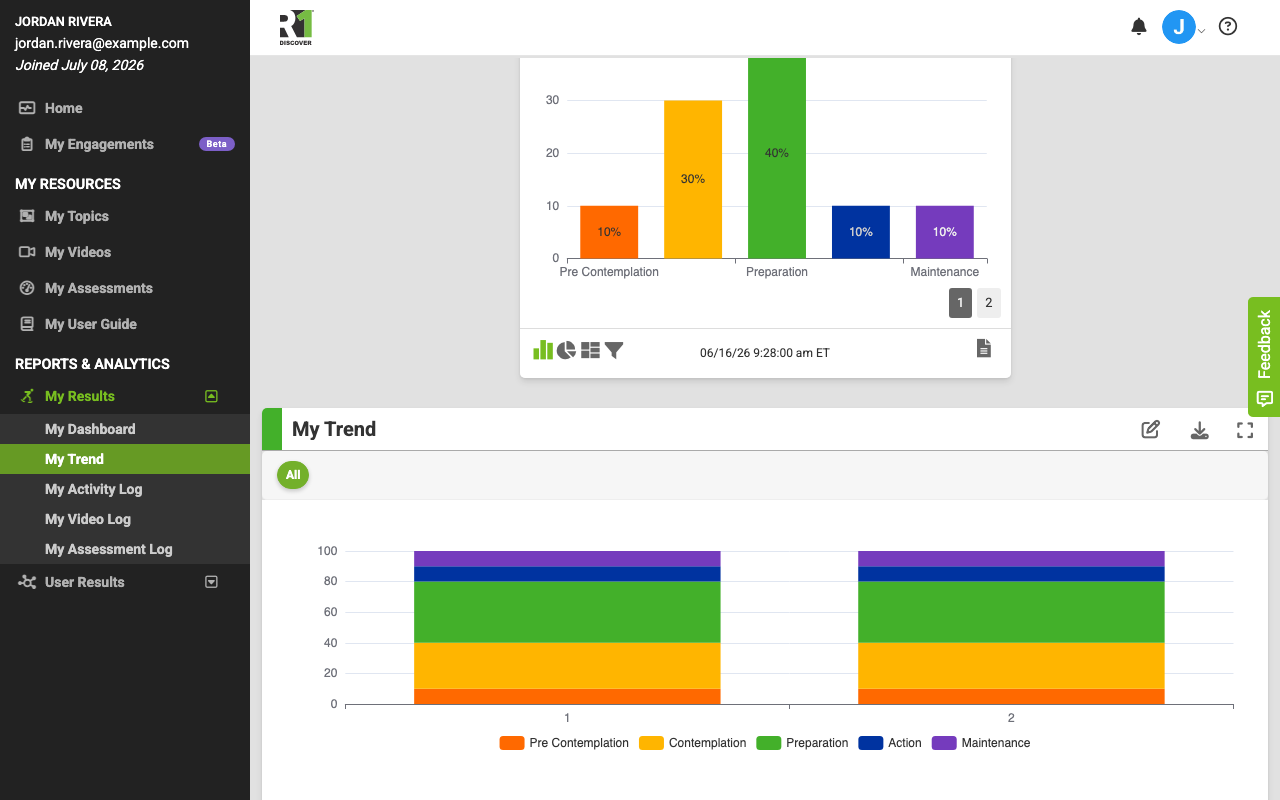
The My Trend tab on your My Results page charts your history for a single activity so you can compare your current results to prior completions without opening individual reports. It shows two linked charts: a top chart with the results of one completion, and a trend chart that plots your results across completions over time.

Accessing My Trend
- In the left navigation, open My Results and select My Trend.
Or, from the My Dashboard tab, select the Trend icon in the bottom-right corner of any activity chart to open My Trend for that activity.
The top chart
The top chart displays your results from a single completion of the selected topic and activity.
- Switch between completions: If you have completed the activity more than once, numbered links appear above the chart — one for each completion. Select a number to load that completion's results. When there are more than five, use the left and right arrows to page through them. If no numbers appear, you have only completed the activity once.
- Completion timestamp: The date and time below the chart shows when the displayed completion was finished, so you always know which result you are looking at.
- Chart types: For sorting-card activities, use the icons in the bottom-left corner to switch between bar chart, pie chart, tree map, and funnel chart views. Knowledge checks display as a pie chart.
- View the report: Select the report icon in the bottom-right corner to open the full completed report for the displayed completion.
The trend chart
The bottom chart plots your results across completions of the same activity, up to 10 completions per page. If you have more than 10 completions, page numbers appear so you can move through your full history.
Use the icons in the bottom-left corner to switch between chart types:
- Bar chart: Your results for each completion as grouped vertical columns.
- Scatter chart: A point for each category in each completion, connected by lines so you can follow each category's trend.
- Area chart: A shaded, colored area for each category across completions.
Changing the topic and activity
The two charts are linked — changing the activity updates both.
- Click the header (the topic and activity title) of either chart.
- In the Change Topic and Activity dialog, select the activity you want to view. Only activities you have completed are listed.
Other controls
- Download and fullscreen: Each chart has a download icon (saves the chart as an image) and a fullscreen icon in its top-right corner.
- Tag filter: If your organization uses activity tags, tag chips appear above each chart. Select a tag to limit the chart to completions with that tag, or All to clear the filter.
Was this helpful?
Thanks for the feedback!