My Home Dashboard
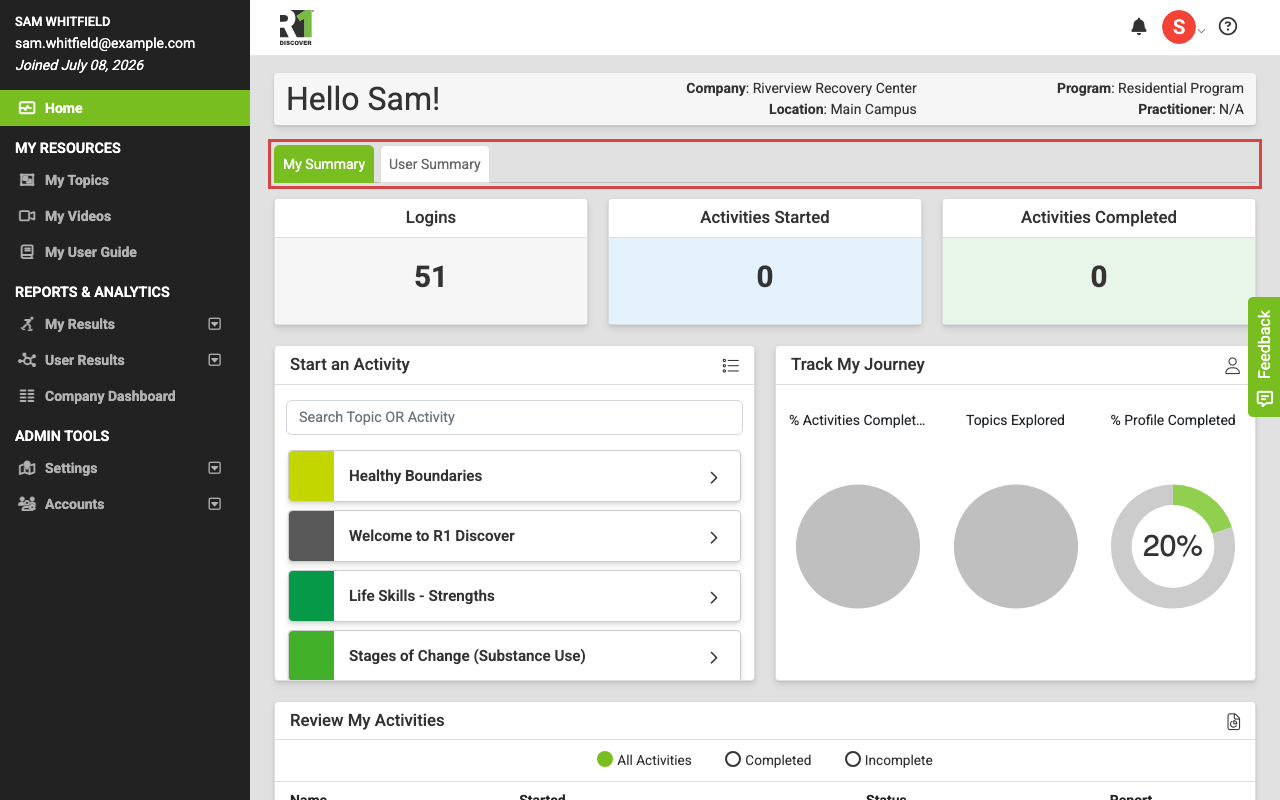
When you log in to R1 Discover, you land on your home dashboard. It is the snapshot summary and action center for your account: start activities, track your progress, and review your recent history — all from one page.

Dashboard header
The header at the top of the dashboard shows basic information about your account:
- Welcome message: A greeting using your first name (or username if no first name is set).
- Company: The company your account belongs to.
- Program: The primary program your account is aligned to.
- Location: The primary location your account is aligned to.
- Practitioner: If you are aligned to a practitioner, their name appears here.
My Summary tab
This is the main landing view for all users. If your account is an admin or practitioner account, the dashboard is split into two tabs — My Summary and User Summary — and you can switch between them at the top of the page.
Top-level metrics
Three metric tiles appear at the top of the My Summary view:
- Logins: The total number of times you have signed in to R1 Discover.
- Activities Started: The total number of times you have started an activity.
- Activities Completed: The total number of times you have finished an activity.
Start an Activity widget
The Start an Activity widget lets you search for any topic or activity and begin it right from the dashboard. Type in the search box to filter the topic list, then expand a topic to see its activities. Depending on your permissions and license, each activity offers:
- Start button: Begin the activity immediately.
- Copy URL button: Copy a direct link to the activity so you can share it.
- QR code button: Display a QR code that opens the activity start page when scanned. The person scanning must have an R1 Discover account.
A check mark next to an activity shows whether you have completed it before — hover over it to see how many times and when you last completed it.
For the full resource library and all supporting content, select the list icon in the widget header or go to the My Topics page.
Some organizations use engagements instead — in that case a My Engagements widget appears here in place of Start an Activity, listing your assigned engagements with a View All link.
Track My Journey widget
The Track My Journey widget shows three charts that summarize your progress:
- % Activities Completed: A pie chart that gains a slice for each activity you complete, shown in the color of the activity's topic. The gray slice represents activities you have not completed yet.
- Topics Explored: A pie chart that gains a slice for each topic you complete an activity in, shown in the topic color. The gray slice represents topics you have not explored yet.
- % Profile Completed: A donut chart showing the percentage of your profile fields that are filled in. Select the person icon in the widget header to go to your profile settings and complete the remaining fields.
Review My Activities widget
The Review My Activities widget lists your recent activity history. From here you can:
- Filter the list: Use the All Activities, Completed, and Incomplete options at the top of the widget. Each row shows the activity name (with its topic color), the date started, its status, and a report link.
- Resume incomplete activities: Select the icon in the Status column of an incomplete activity to pick up where you left off.
- Review a completed report: Once an activity is completed, its results stay in your profile. Select the icon in the Report column to open the report at any time.
- Go to My Activities: Select the chart icon in the widget header to open your full My Activities dashboard and dive deeper into your results.
User Summary tab (admin and practitioner accounts only)
If your account is an admin or practitioner account, the User Summary tab gives you a snapshot of activity across the users and admins you are permissioned to see. Regular user accounts do not see this tab.
The User Summary widgets load the first time you open the tab, so the dashboard itself opens faster. Each widget shows a Loading... indicator until its data is ready, and each one appears as soon as it has loaded. Screen readers announce each widget as it finishes. If a widget cannot be loaded, it says so; reload the page to try again.
Top-level metrics
Six metric tiles appear at the top of the User Summary tab:
- Logins: Total sign-ins by the accounts you can see.
- Activities Started: Total activities started by those accounts.
- Activities Completed: Total activities completed by those accounts.
- Active Admins: The number of admin accounts that have logged in.
- Active Users: The number of user accounts that have logged in.
- Total Engaged Users: The number of accounts that have taken at least one activity.
Review User Activities widget
This widget lists the most recent activity of the accounts you can see. Which options appear depends on your permissions:
- Filter by Users or Admins: Use the options at the top of the widget to switch between user and admin activity.
- Open a member's profile: Select a username to view that member's information and activity history.
- Open a member's dashboard: Select the chart icon in the Actions column to open the User Activities dashboard filtered to that member.
- View a completed report: Select the report icon in the Actions column to open the report for that activity.
- See all user activities: Select the list icon in the widget header to open the full User Activities page.
Activity Across Topics widget
A column chart summarizing which topics the accounts you can see have explored. Each column is shown in its topic color — hover over a column to see the topic name and count. Filter by All Time, This Month, or This Week.
Logins Over Time widget
An area chart of sign-ins over time for the accounts you can see. The green series is Users and the blue series is Admins. Filter by This Year, This Month, or This Week.
Most Popular Activities widget
A pie chart of the most-taken activities among the accounts you can see. Each slice is shown in the activity's topic color — hover over a slice to see the activity name. Filter by All Time, This Month, or This Week.
Was this helpful?
Thanks for the feedback!